At a glance. Read a layer production curve across onset, peak and late lay, and compare flock records with the appropriate breeding-company performance guide.
Every laying flock follows a shape you can draw on a graph. It starts near zero, climbs steeply for a few weeks, plateaus at a high 90-96% rate of lay, and then drifts slowly downward for the rest of the cycle. Managers who understand that curve stop reacting to daily noise and start managing the trend. A single healthy hen can lay roughly 500 eggs over about 700 days in a modern extended cycle, but only if she is carried smoothly up the ramp, held at peak, and let down gently. This article walks the whole curve from the first egg to the last, with the numbers you can benchmark your own flock against.
The Curve in Three Phases
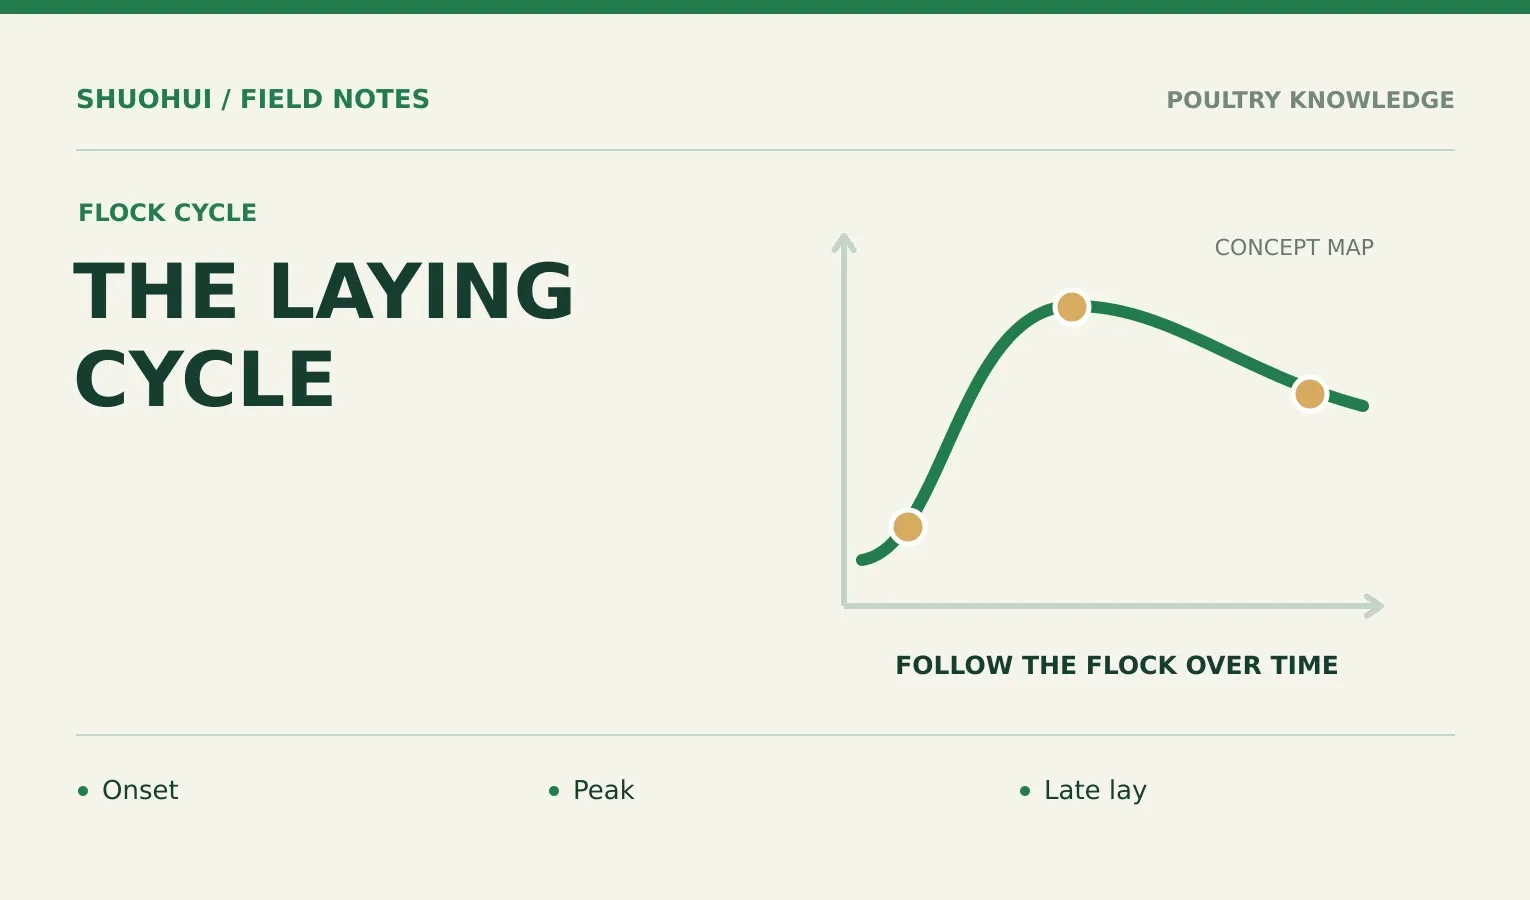
Think of the production cycle in three broad phases. The ascending phase runs from first egg to peak, a period of only a few weeks in which the flock's output rises faster than at any other time. The peak or plateau phase is where a well-managed flock sits at or above 90% for a stretch of weeks or months. The declining phase is the long, gentle slope down to depletion, where persistency separates an average flock from an excellent one.
- Ascending — steep climb from ~5% to peak, roughly 18 to 28 weeks of age
- Peak plateau — sustained 90-96% lay, typically 25-30 weeks
- Declining — a loss of about 0.5-1% per week once past peak
Onset of Lay: The First Eggs
The first eggs usually appear around 18-20 weeks of age, when the flock reaches roughly 5% lay. These early eggs are small and the rate climbs quickly. By around 22 weeks a flock on target passes 50% production, and by about 24 weeks it should be near 80%. Sexual maturity is driven by both body weight and the lighting program, so pullets that hit their target weight and receive the right photostimulation come into lay evenly rather than in a straggling, drawn-out fashion.
A tight onset matters because the steepness of the early ramp predicts the height of the peak. Flocks that dribble into production over many weeks rarely reach the same peak as flocks that switch on together.
Climbing to Peak: The Steep Ramp
The climb from 50% to peak is the most nutritionally demanding window in the hen's life. She is still growing frame and building medullary bone reserves while simultaneously producing an egg most days. Underfeeding energy or protein here caps the peak permanently — you cannot recover a peak you failed to reach. This is the phase where the "lift nutrition before the peak" principle applies: enrich the diet a week or two ahead of the rise so the hen is never chasing her own output.
Peak Production: The 90-96% Plateau
Peak lay lands at about 25-30 weeks of age. A good commercial flock peaks at 90-96%. White-shell (light) breeds tend to peak higher and earlier, commonly 95-97% around 28 weeks, while brown-shell (medium) breeds peak a little lower, generally 90% or above. Peak is not a single day; it is a plateau you defend. The goal is to hold the flock as close to peak as possible for as many weeks as possible, because every extra week near peak adds meaningfully to lifetime egg numbers.
White Versus Brown: Two Different Curves
The two main commercial types draw slightly different curves. Understanding which you run changes your expectations.
- White-shell layers — higher, earlier peak (95-97% near 28 weeks), lighter body, superb feed efficiency
- Brown-shell layers — slightly lower peak (~90%+), larger eggs, calmer temperament, heavier feed intake
Neither is "better" — they simply have different production signatures, and benchmarking a brown flock against a white breed's peak leads to false alarms.
The Post-Peak Decline: Slow and Steady
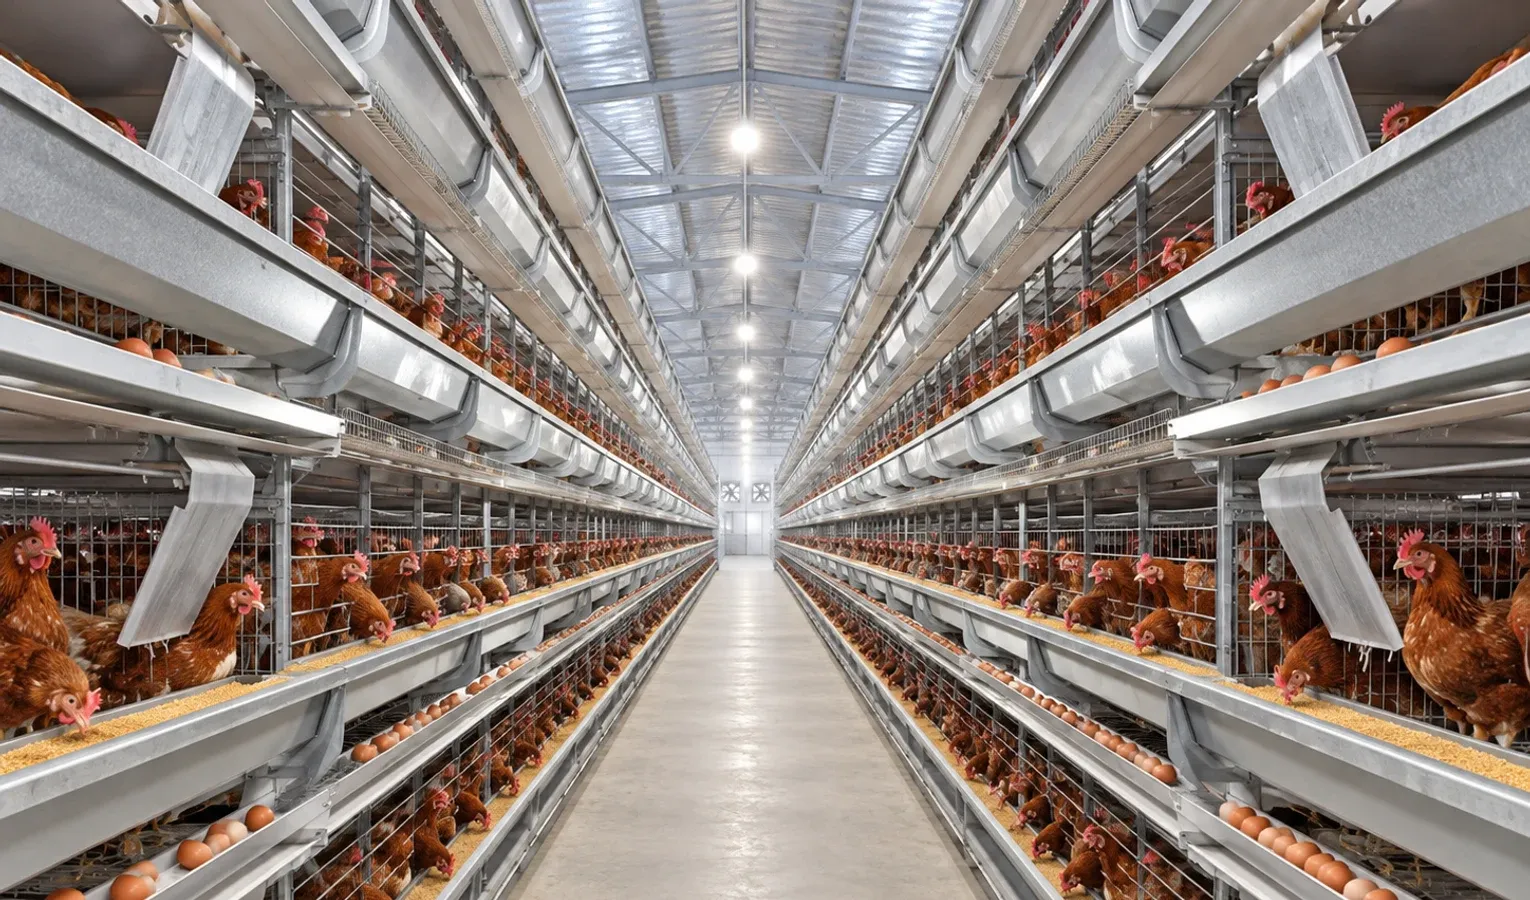
Once past peak, a flock loses roughly 0.5-1% production per week under good management. That gentle, predictable slide is normal and healthy. A sudden drop of several percent in a single week is not part of the curve — it is a warning sign of disease, a feed problem, water restriction, a lighting fault, or heat stress. Learning to tell normal decline from an abnormal break is one of the most valuable skills a layer manager can have.
By roughly 12 months into lay, a typical flock has declined to around 65% production. Whether you continue past that point, molt the flock, or deplete depends on egg prices, shell quality, and the individual flock's persistency.
Persistency: The Real Mark of a Good Flock
Two flocks can reach the same peak yet finish the cycle far apart because of persistency — how well they hold production as they age. A flat, slow decline curve beats a high peak that collapses. Persistency is built long before lay: uniform pullet rearing, correct body weight at onset, a well-timed lighting program, and steady late-cycle nutrition all flatten the decline. When you compare flocks, look less at the peak height and more at how gently the line falls afterward.
Egg Numbers Across the Cycle
The area under the curve is what pays the bills. A modern hen can produce about 500 eggs over roughly 700 days in an extended single cycle. That figure assumes a strong peak, good persistency, and low mortality. Every point of production lost to a disease break, a heat wave, or a nutrition error is subtracted permanently from that lifetime total — you never make up eggs that were never laid.
Feed Conversion Across the Curve
Feed efficiency shifts as the curve moves. Across the whole laying period, a good flock converts feed to egg mass at roughly 2:1 (about two kilograms of feed per kilogram of egg). Efficiency is best around peak, when nearly every hen lays daily, and worsens in late lay as production falls but maintenance feed intake does not. Watching feed conversion month by month tells you when the economics of the flock are turning.
Egg Size Rises as Rate Falls
The curve has a mirror image: as the rate of lay declines, average egg weight climbs. First eggs are small — often around 45 g — and egg weight rises steadily through the cycle toward 65 g or more in late lay. This trade-off matters commercially, because a flock past peak may be laying fewer but larger, higher-value eggs. Reading both curves together gives a truer picture than watching production rate alone.
What Knocks a Flock Off the Curve
Several forces pull a flock below its genetic curve. Recognizing them early lets you correct course before eggs are lost for good.
- Heat stress — intake and lay fall sharply above 28-30°C
- Nutrition gaps — energy or calcium shortfalls flatten the peak or crack the plateau
- Disease — a respiratory or reproductive infection causes a sudden, sharp break
- Lighting errors — day-length cuts or fixture failures depress lay within days
- Water restriction — even brief shortages hit production immediately
Any abnormal drop deserves a systematic check of feed, water, light, temperature, and health, ideally with your veterinarian.
Plotting Your Own Curve
The management value of the curve only appears when you plot your own flock against the breed standard every week. Record daily egg numbers, calculate weekly percent lay against hens housed, and graph it beside the target. Deviations show up as gaps between your line and the standard, and the shape of the gap often points to the cause — a capped peak suggests a rearing or early-lay nutrition issue, while a sharp mid-cycle notch suggests a health or environmental event.
Deciding When to End the Cycle
Every curve ends. The decision to deplete or molt comes down to production rate, shell quality, feed cost, and egg price. Many flocks are carried until production falls to around 65% and shell quality begins to slip, at which point managers either send birds to processing or induce a molt to start a second, shorter cycle. There is no single right age — it is an economic judgment made flock by flock, and worth reviewing with your breeder's management guide.
Let Us Help You Read Your Flock's Curve
A production curve is only useful when it is matched to the right housing, feeding, and environment for your birds. Tell us your flock size, breed, and target production age, and our team will help you set realistic weekly benchmarks and choose equipment that helps you reach — and hold — a strong peak. Share your numbers and we will map the curve with you.
Visual checklist
Related reading
Layer Peak Production: Preparation and Monitoring
Layer Phase Feeding: Matching Nutrition to Production
Further reading
Use the management guide for the actual breed, age and housing system when selecting flock targets. Review changes with the farm team and the relevant nutrition, health or equipment specialist.